COVID-19 Analysis of Infection Rate Updated: 22-Mar-2020
Posted: Monday, March 23, 2020
By:
Dror Rom
Categories:
COVID-19
|
Statistics
Disclaimer: Any information provided in this article may be inaccurate, and therefore misleading. You agree that by reading the information below, you will not hold the authors of this article, and the publisher of this website responsible or liable for any adverse outcome resulting from your use of this information. You agree that the information in this article is provided as “use at your own risk”.
Data and analysis may be updated as information becomes available.
Analysis of Covid-19 infection rate – by Dror Rom, PhD, Logecal Data Analytics (www.logecal.com)
March 22, 2020
In the previous post, we have used daily infection rates around the world to help understand the spread of covid-19 in various countries. Our goal is to help predict the progression of the daily infection rates and assess when the pandemic will subside. To that end, we must first understand some mathematical characteristics of an epidemic. The speed in which an unmitigated infection spreads in communities is measured by the number of person-to-person transmissions that occur for each infected person, that is, how many persons each infected individual will transmit the virus to. In epidemiology, this number is termed R0, or reproductive rate. The higher the number, the greater the speed of the epidemic. To illustrate the importance of this number, consider an example infection whose R0 is 2. The first infected person will transmit the virus to two other persons, each will go on to transmit the virus to two other individuals, and so on.

This will go on for a while, but it is readily obvious that the rise in cases is exponential in the early stage of the pandemic. The person-to-person transmission rate, R0,
evolves over time due to various factors (e.g., the effect of weather) and eventually will go down as measures to control the spread are implemented. The higher the R0, the higher speed of infection in communities. Covid-19 is thought to have an R0 of about 2.5. For comparison, the H1N1 swine flu virus, had an R0 of 1.4-1.6.
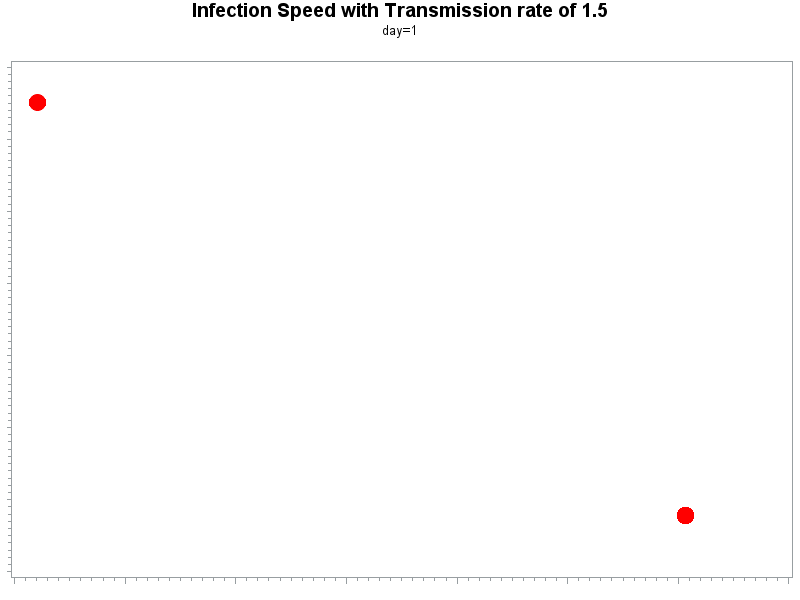
Here is an animation showing a spread of an infection like covid-19 with an R0 of 2.5
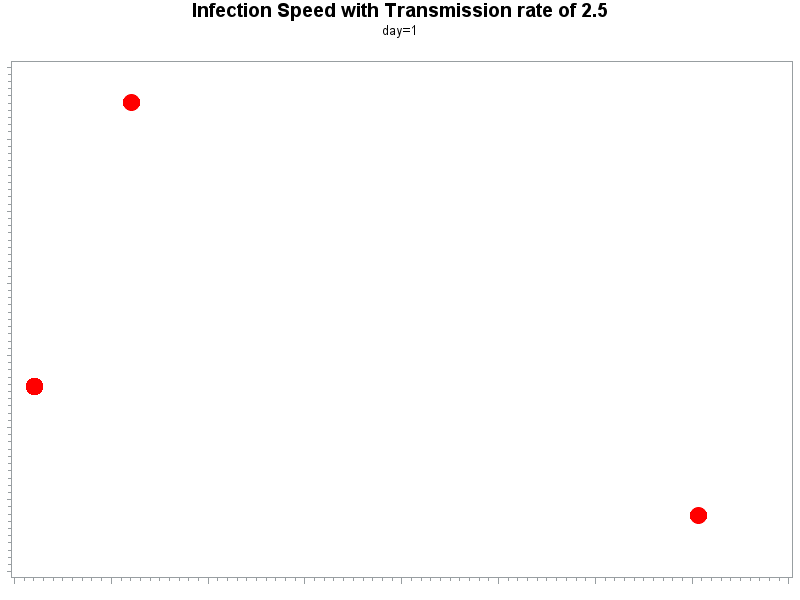
verses an H1N1 like infection with an R0 of 1.5.
To contain an epidemic, R0
must be brought down to less than 1. In the previous post, we showed how the epidemic had slowed down in some countries, including China and South Korea. The exponential rise in the number of infections in the early stages of the epidemic was due to the high R0 initially. When various measures were introduced, R0 fell, leading to an eventual stabilization and control of the spread.
How is R0 related to the daily infection rate?
When R0 is 1, meaning, on average, each person transmits the virus to one other individual, say over a period of x days, the number of new daily infections will become constant. This will cause the total number of infections to stabilize due to the fact that a large portion of the population will eventually get infected (and presumably be immune to further infections, at least for a while). A sign that the spread is stabilizing is the linearization of the new daily infections, and further, turning it from having a convex (an upward) to a concave (a downward) curvature. The time at which this occurs is the inflection point.
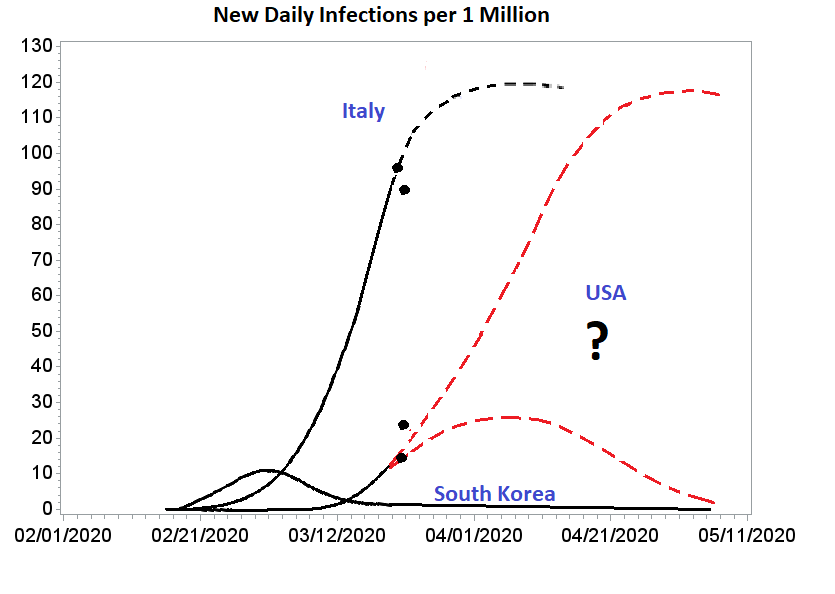
South Korea had an inflection point around the last week of February. Within two weeks, the number of new daily infections began to fall, indicating that the epidemic was halted.
What you see is Not what you get.
The number of new daily infections is most likely inaccurate. There are several reasons for that, most notably, it reflects only those who were tested because they may have passed the criteria required for testing. In the USA, testing has been increasing over the past few days, and the rise in the daily infections may reflect the increased testing. One other major reason for the inaccuracy is the lag between the time of the transmission and the time testing has come back positive. All the above suggest that in the early stage of an epidemic, the number of new daily infections is markedly under- estimating the true rate, especially one with a fairly high R0
such as with covid-19. On the other hand, when the rate of infections is slowing down, the number of new daily infections tends to over-estimate the true rate. This suggests that when an inflection point is observed using the current new daily infections, inflection may already have occurred.
What does the evolution of the epidemic in South Korea tell us?
In the previous post, we analyzed the past and present new daily infections in other countries, in particular, Italy and the USA. Western Europe and the USA initiated various control measures well after South Korea had done so, and therefore entered into a much more explosive phase in the rise of new daily infections. The situation in Italy is compounded by various factors. We use it as a benchmark opposite that of the South Korean model. An examination of the new daily infections in Italy suggests that the curve has substantially linearized in the last few days, which appears to suggest that the inflection point has either already occurred, or about to occur. This is based on a statistical analysis that successively models and compares a regression of the new daily infections over time. This model was checked on the South Korean data and appears to perform well.
In the USA, the rise in daily infections continues to accelerate, primarily in NYC. We note that the USA data may be somewhat misleading because the rise in the infection rate may be due to the increased testing. This factor should diminish as testing becomes more widely available over the next few days.
To check how the previous projections perform, we have added the new daily infections (black dots) since the last post to the previously made projections. The new data appear to follow the projections quite closely.
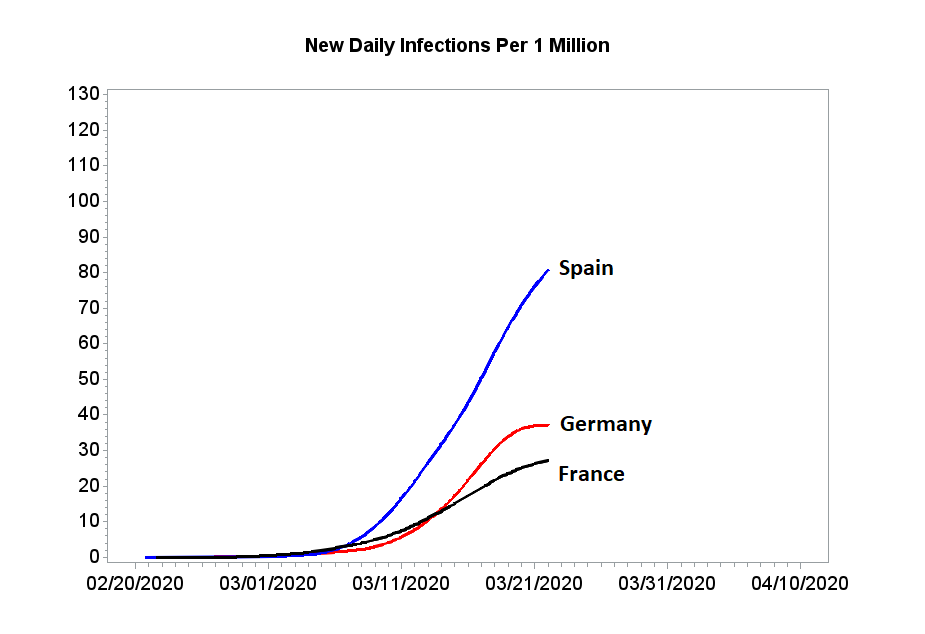
Good news for some western European countries
Germany, Spain, and France may have reached an inflection point. Analysis of the daily infection rate in these countries suggests that they are turning the corner. These countries have recently implemented various control measures which appear to have curbed the trajectory of the epidemic.
Tagged:COVID-19