COVID-19 Analysis of Infection Rate
Posted: Saturday, March 21, 2020
By:
Prosoft Clinical
Disclaimer: Any information provided in this article may be inaccurate, and therefore misleading. You agree that by reading the information below, you will not hold the authors of this article, and the publisher of this website responsible or liable for any adverse outcome resulting from your use of this information. You agree that the information in this article is provided as “use at your own risk”.
Data and analysis may be updated as information becomes available.
Analysis of Covid-19 infection rate – by Dror Rom, PhD, Logecal Data Analytics (www.logecal.com)
As the virus continues to spread across the world, more data is becoming available. In some countries, the spread has been halted and reversed, while other countries are exhibiting a sharp rise in the infection rate. China has appeared to have stopped the epidemic within its borders. South Korea is one of the first countries to implement drastic containment and testing within its borders, making it serve as a good model for projecting the progression of infections if similar containment methods are implemented.
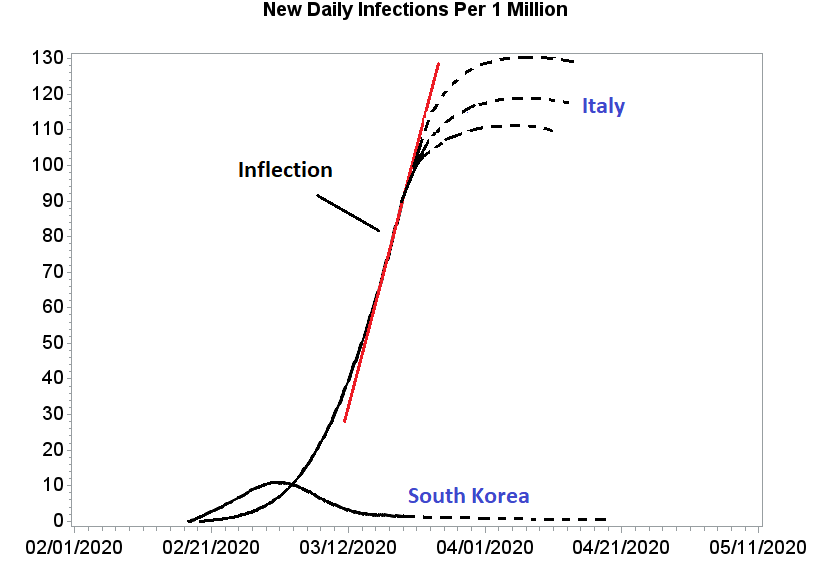
South Korea: When looking at the number of new infections per 1 million people over time, the following patterns clearly emerge: 1. After the number of new daily infections initially accelerated, the trend stabilized around February 20 which can be considered the inflection point. Around March 4th, the number of new daily infections started to drop.

The graph above was generated from data on worldometer.info using spline interpolation techniques.
South Korea has implemented various steps to blunt the spread, including widespread testing, and other containment methods. This model for blunting the spread was slower to be implemented in the EU, USA and other regions of the world. Nevertheless, current measures are being implemented across the world, and assuming these containment methods have equal effects on the spread, this is what can be expected in some “hotspot” regions.
Italy: Italy is currently the biggest hotspot area. After exhibiting a massive number of new cases, the country has implemented various containment methods which are helping to curb the growth of new infections. It is now seeing an inflection point. If the model of South Korea holds, Italy should begin to see a drop in new cases around April 1 to April 15, 2020. Below is the projection of new daily infection rates. The dashed line represents projection and the solid lines bracketing it represent the unknown factors which may have impact on the infection rate.
USA: containment methods have been implemented in recent days. In part, more widespread testing has been made available, and as a result, more cases are being detected. Thus, a spike in the number of daily cases may be a result of more testing done rather than an increase in infection rate. It is therefore premature to project the future progression of infection rate, and when an inflection point will be reached, or perhaps, has already been reached. The graph below shows two scenarios: the “Italian Model” and the “Korean Model” and suggests that the infection rate will be curbed between 2 weeks (Korean Model) and 6 weeks (Italian Model). In the next few days, as more data becomes available, a more accurate progression of infection rate can be made.
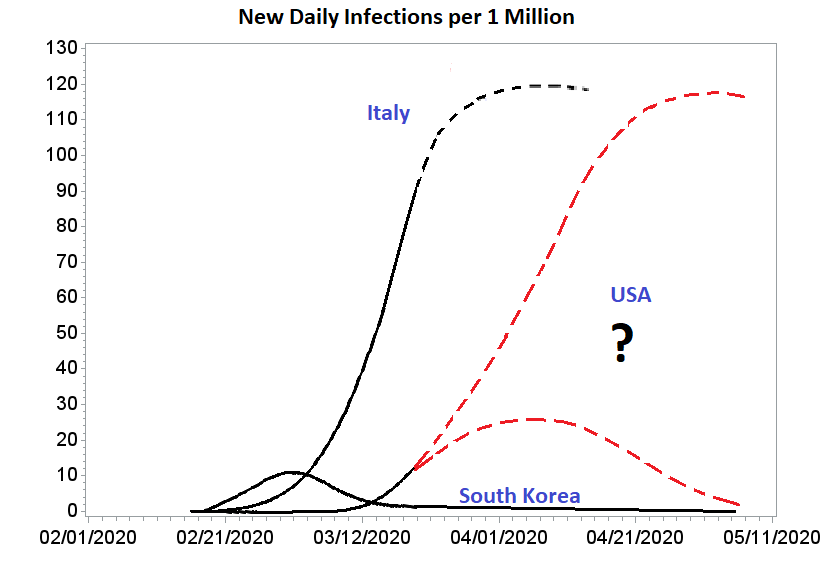
Note added 3/21/2020: The Current progression rate of number of daily new infections in the USA does not appear to follow the Italian model. The USA curve is flatter than the Italian curve. However, it is not clear whether an inflection point has yet occurred in the USA. More data is needed to asses this critical feature of the curve.
Important Note: Many factors contribute to the infection rate, therefore, any projections that are based on different countries are subject to substantial variability. Different regions within the same country may exhibit different progression rates, due to population density, age, and containment methods.
Thus, in the USA, highly populated areas such as NYC, may be on a different trajectory than some other regions. What is important, though, is that containment methods such as quarantines, social distancing, and others, no matter what region, have the most pronounced effect on the progression rate. With those containment methods in place, every region should see a slowing of new daily infections within a few weeks.